Microsoft Power BI Dashboards

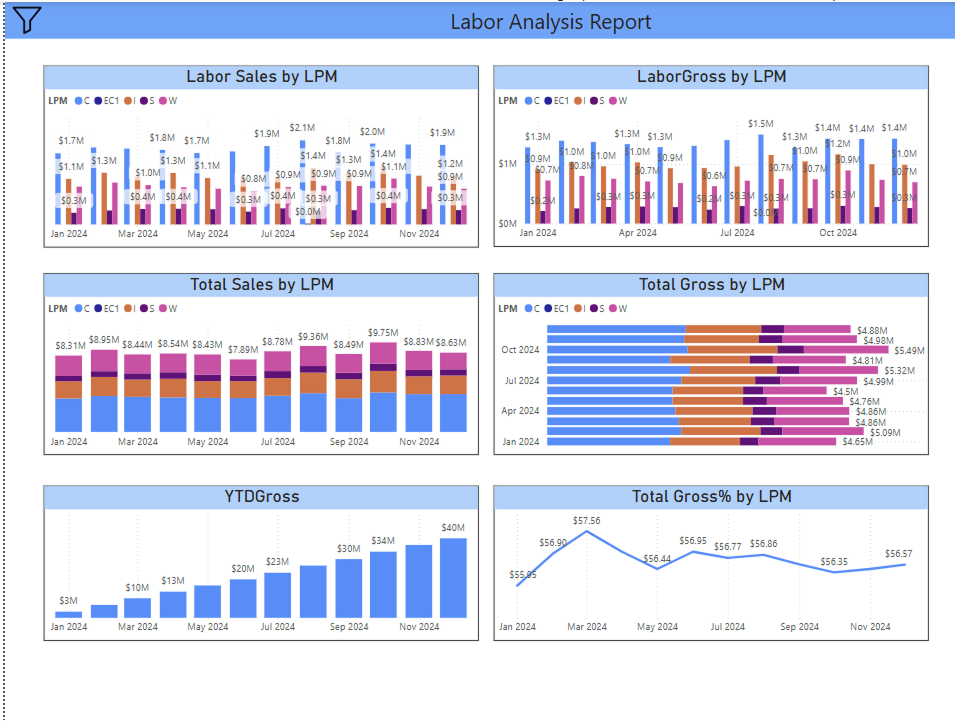
Sales Summary & Performance Insights – Quarterly Trends Across Business Units

Sales Summary & Performance

Sales Performance Overview – Monthly Breakdown by Region

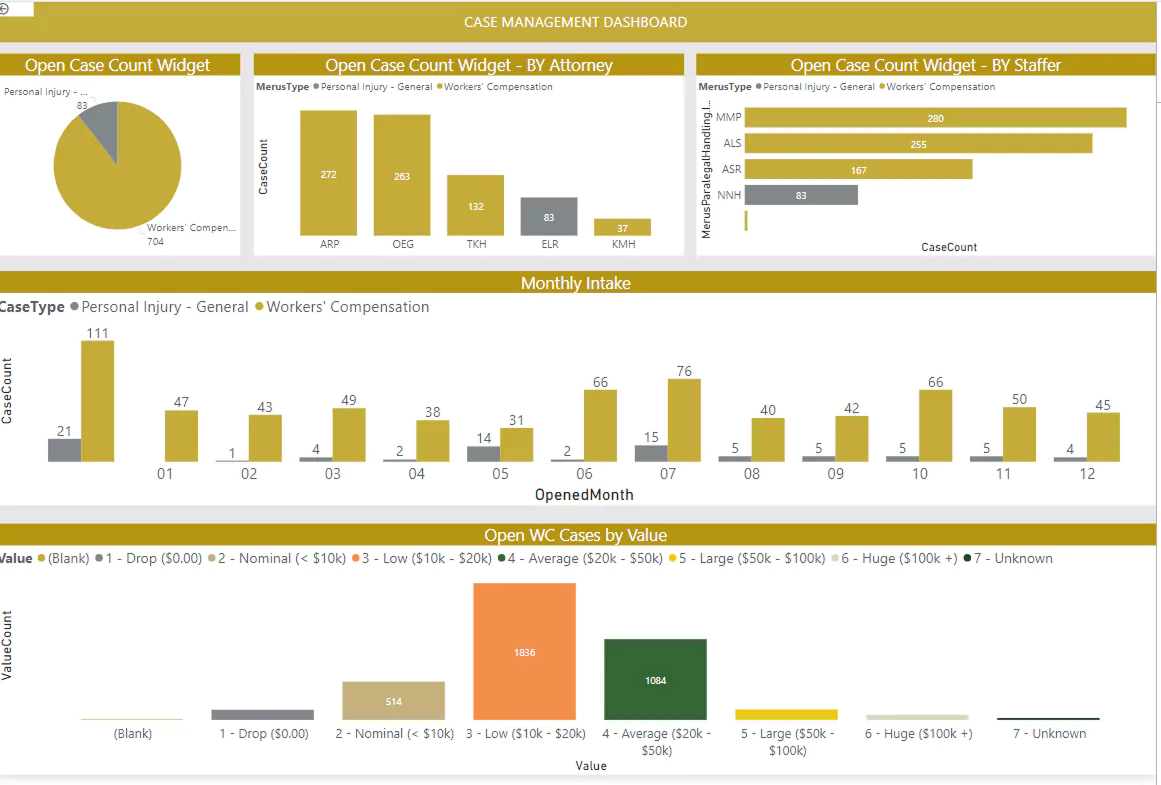
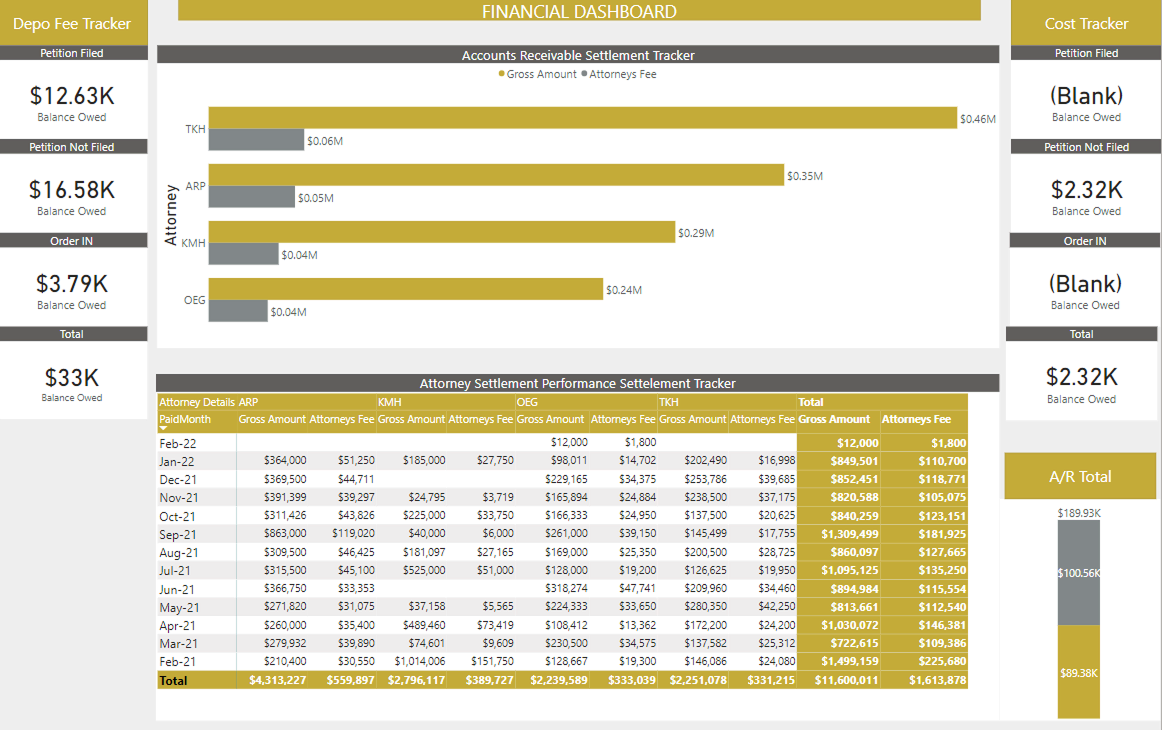
Highlights top-performing regions and monthly revenue trends.

Sales Summary & Performance

Revenue vs. Target – Year-to-Date Comparison

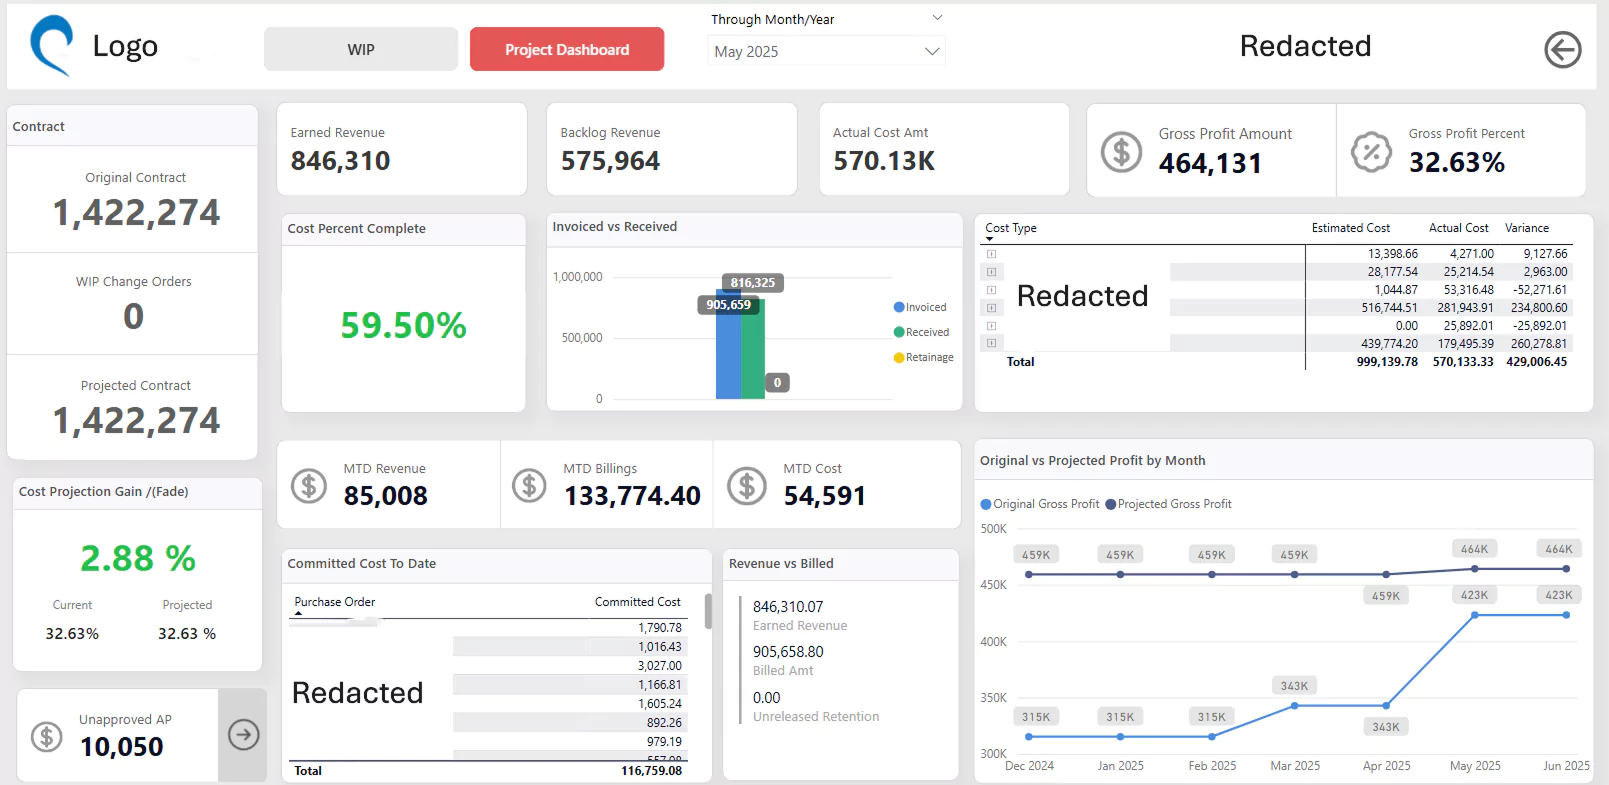
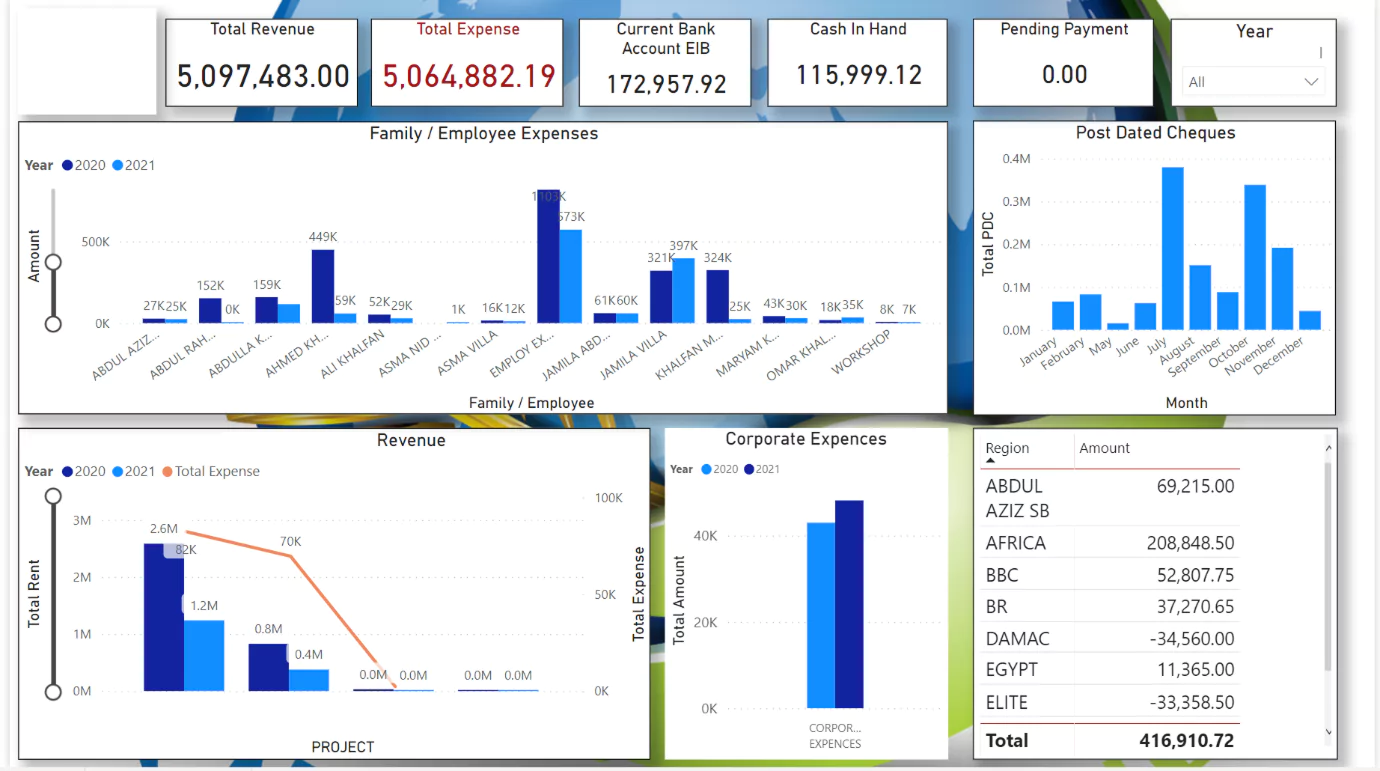
Visualizes actual revenue against forecasts with KPIs.

Revenue vs. Target

Customer Acquisition Sources – Funnel & Trend Analysis

Breaks down where new customers are coming from and how that’s changed over time.

Customer Acquisition Sources Customer Acquisition Sources

Product-Level Profitability – Top & Bottom Performers

Ranks products by margin and volume; great for strategic planning.

Product Level

Service Usage Dashboard – Category-Wise Engagement

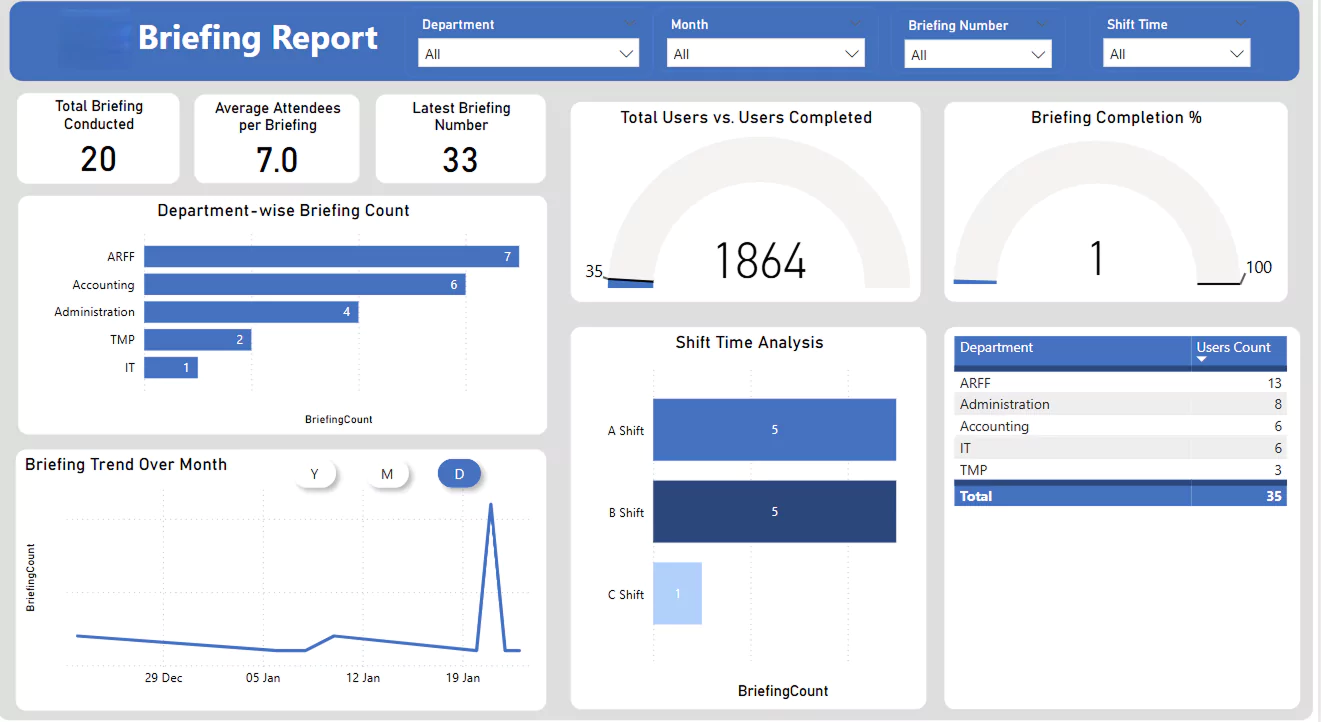
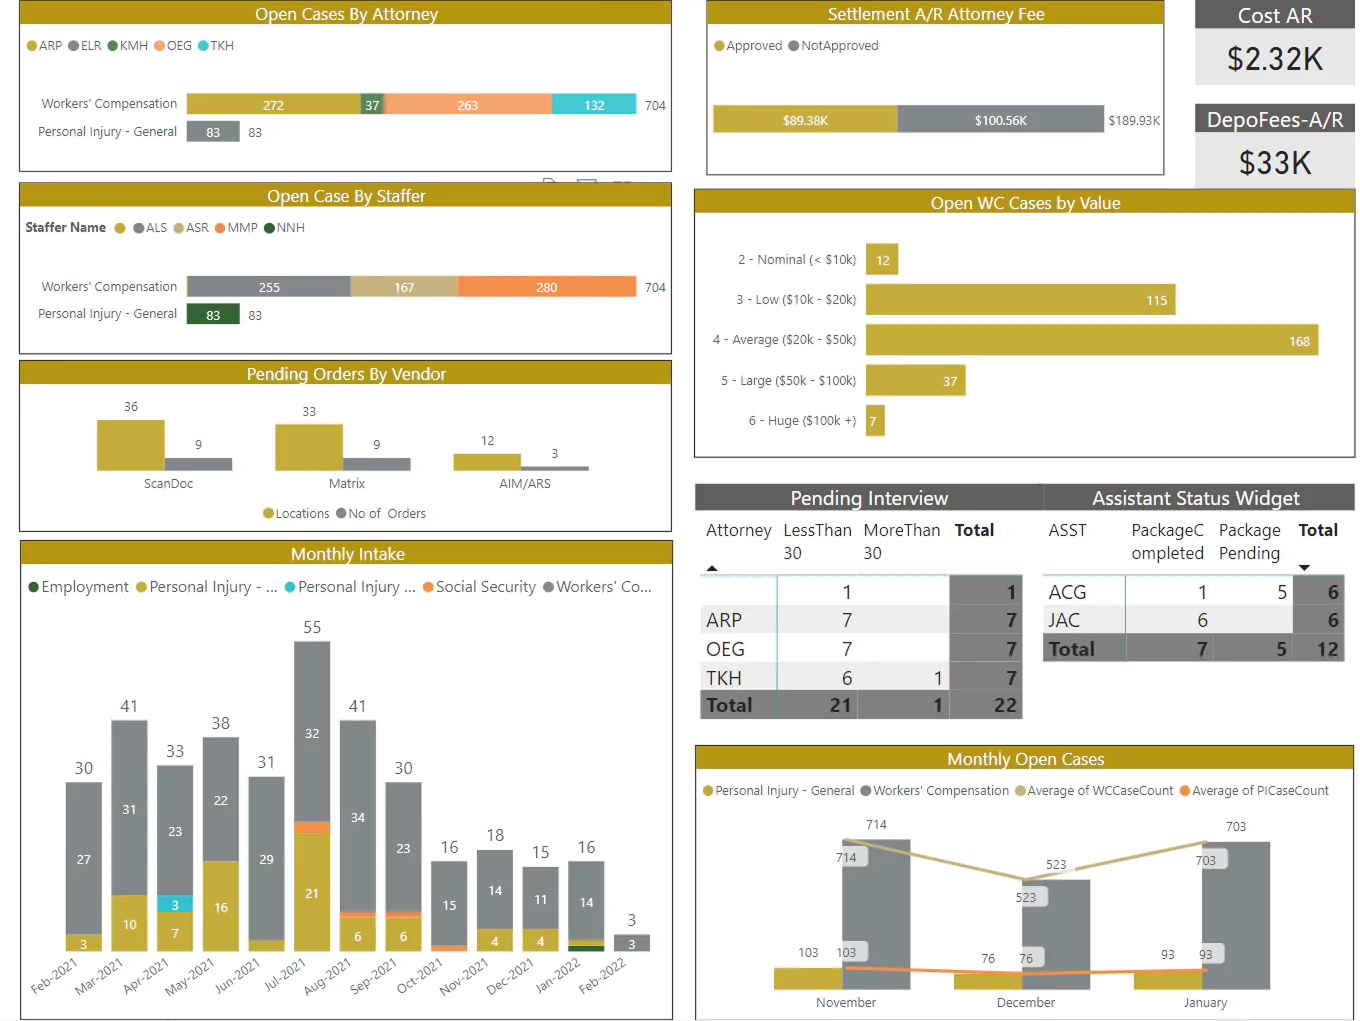
Showcases frequency and popularity across service types.

Service Usage Dashboard

Operational Efficiency Tracker – Daily SLA Compliance

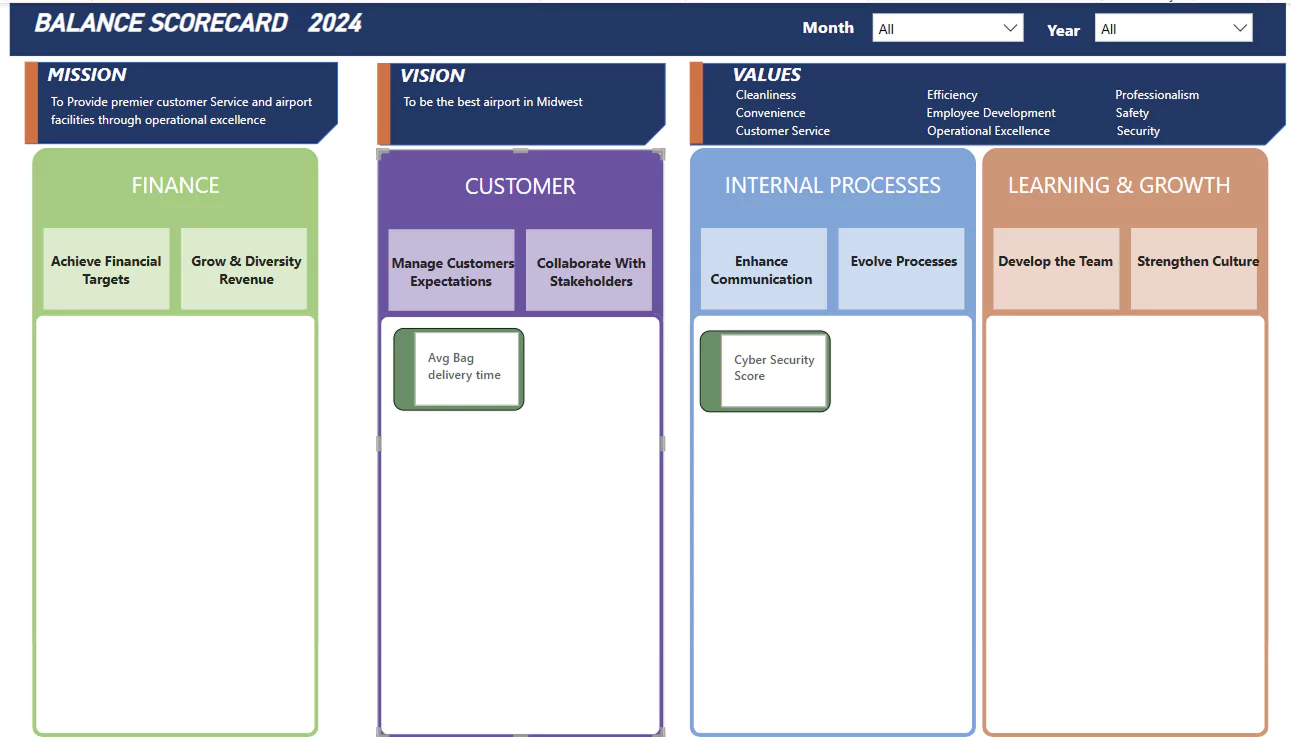
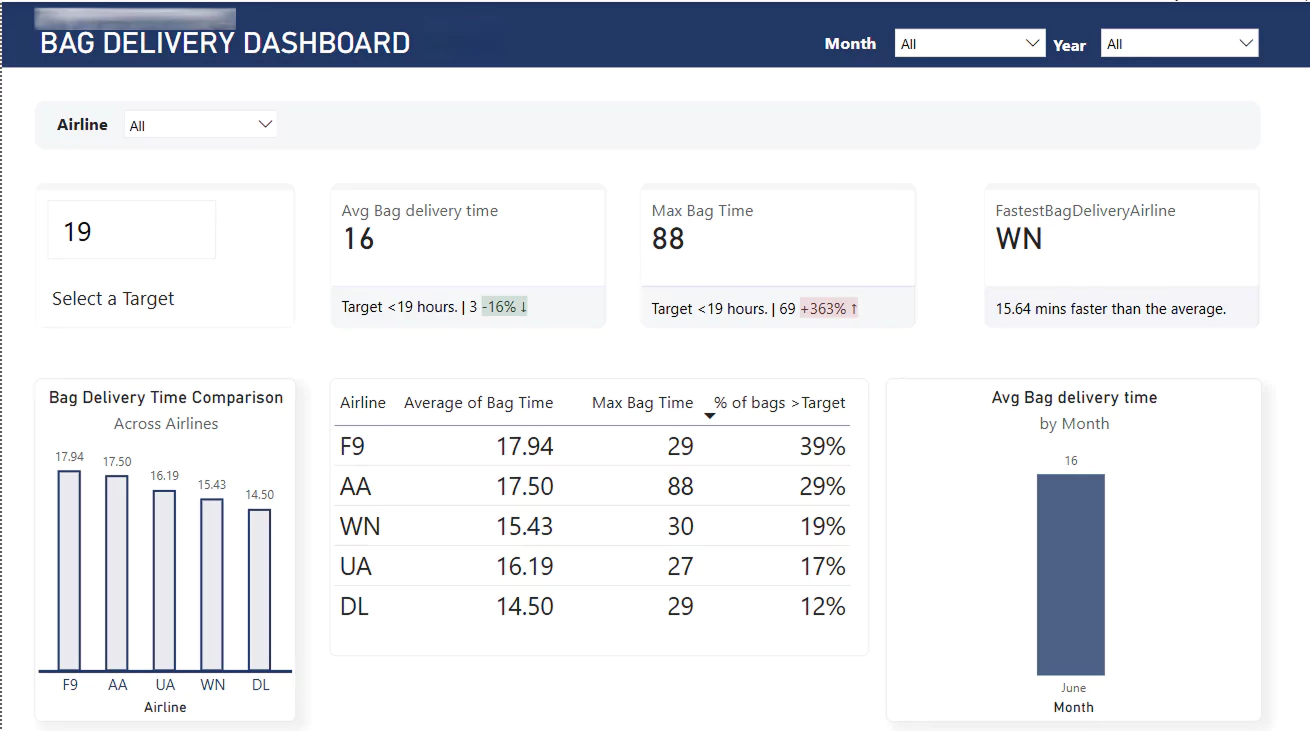
Monitors performance against service level benchmarks.

Operational Efficiency Tracker

User Feedback Sentiment – NPS & Review Distribution

Combines survey data and sentiment analysis for customer insights.

User Feedback Sentiment

Financial Snapshot – Expense vs Revenue Drilldown

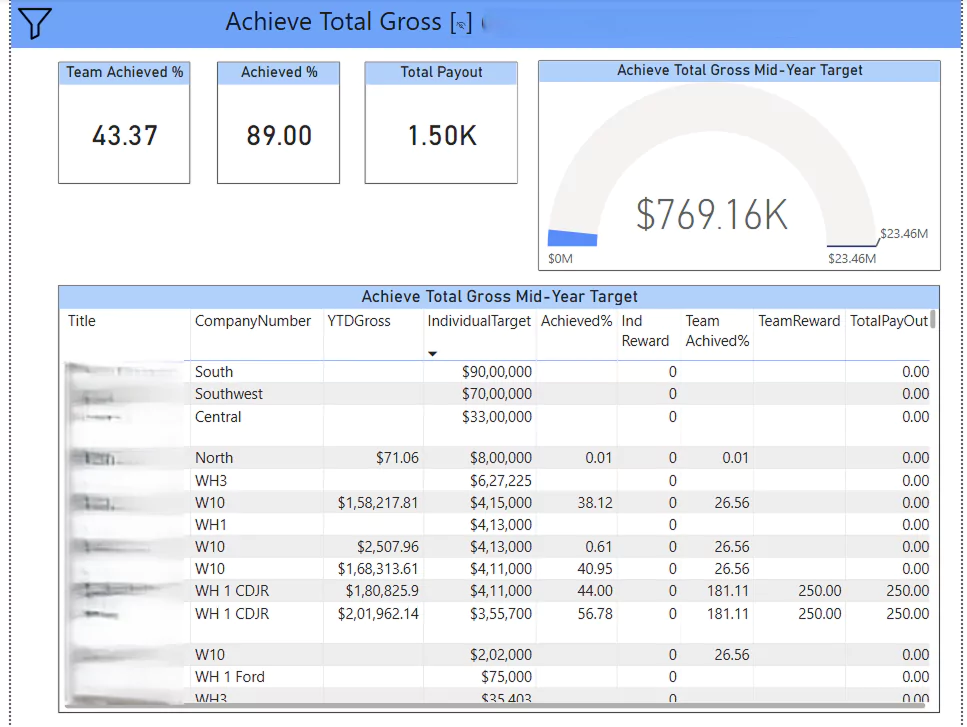
Provides high-level financial ratios and detailed breakdowns.

Financial Snapshot

Team Performance Metrics – Department-wise KPIs

Helps assess individual and team contributions over a timeframe.

Team Performance Metrics Team Performance Metrics

Interactive Profit & Loss Statement – Filterable by Division

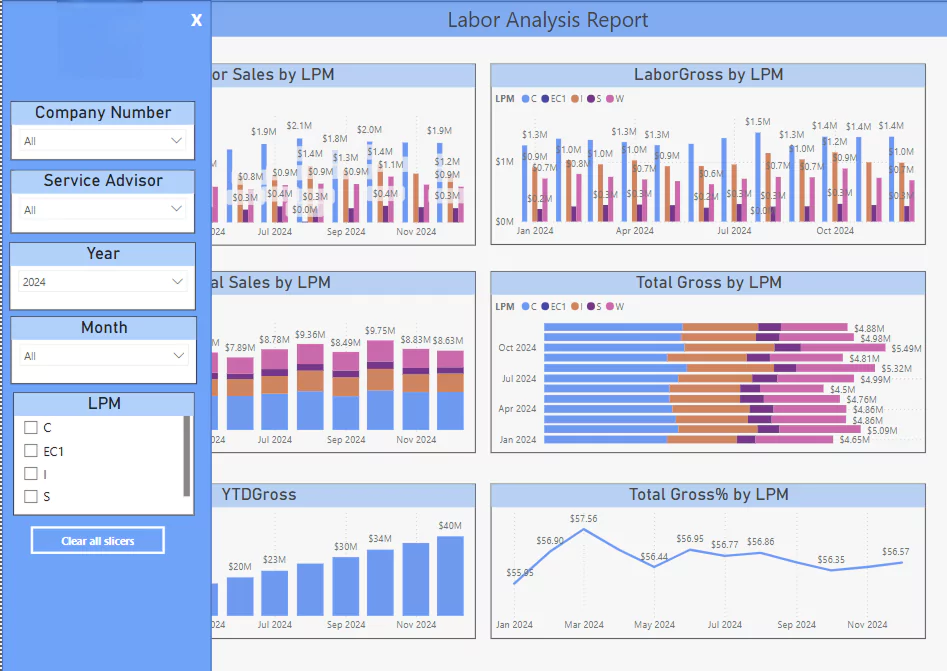
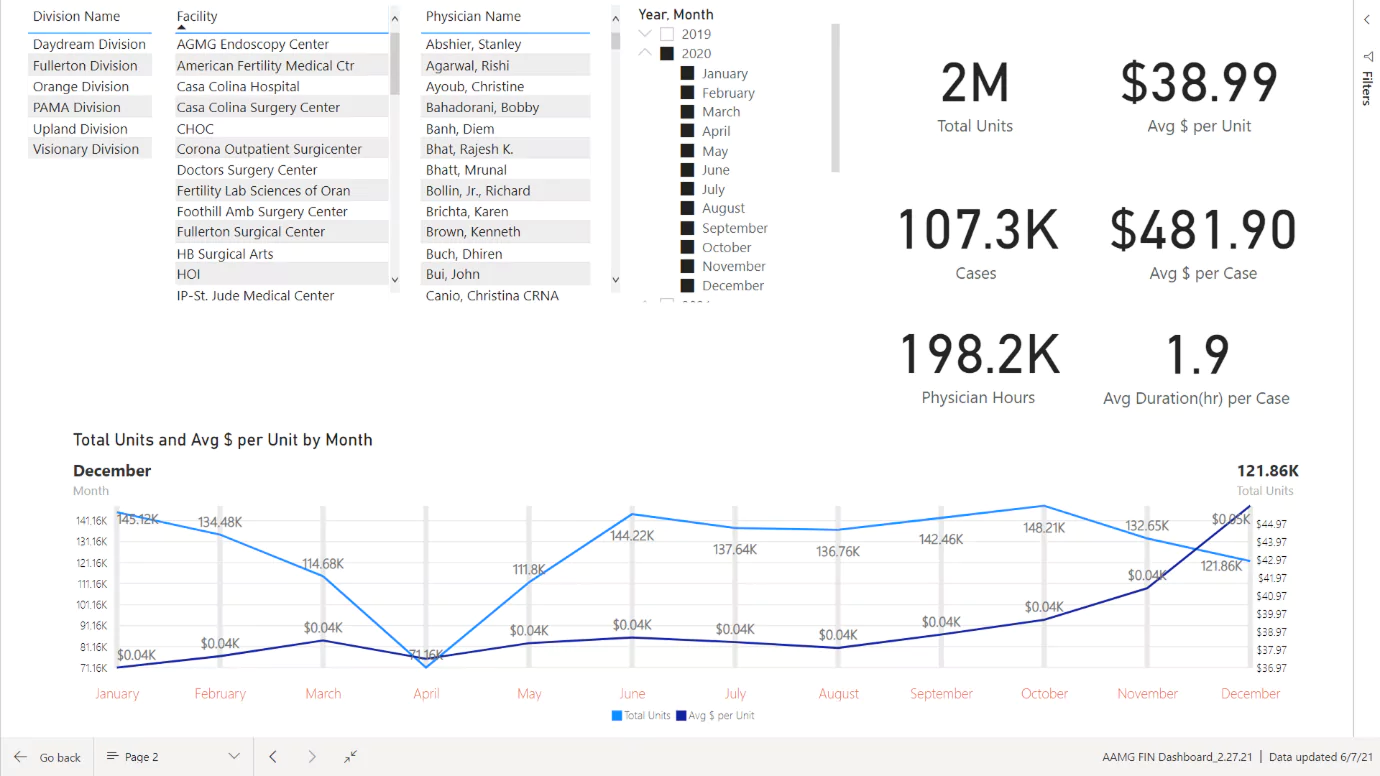
Enables dynamic exploration of divisional financials

Interactive Profit & Loss Statement